The line graph below shows the average monthly temperatures in three major cities.
Summarize the information by selecting and reporting the main features, and make a comparison where relevant.
You should write at least 150 words
The chart below shows the amount of leisure time enjoyed by men and women of different employment status.
Summarize the information by selecting and reporting the main features, and make a comparison where relevant.
You should write at least 150 words
The table below gives information about the average annual spending of university students in three different countries.
Summarize the information by selecting and reporting the main features, and make a comparison where relevant.
You should write at least 150 words
| Countries | Country A | Country B | Country C |
|---|---|---|---|
| Total spending | US$ 5000 | 4500 | 1500 |
| Different living costs | |||
| Accommodation | 45% | 35% | 30% |
| Food | 22% | 28% | 36% |
| Books | 3% | 9% | 21% |
| Leisure | 22% | 23% | 12% |
| Others | 8% | 5% | 1% |
The pie charts below show the average household expenditures in Japan and Malaysia in the year 2010.
Summarize the information by selecting and reporting the main features, and make a comparison where relevant.
You should write at least 150 words
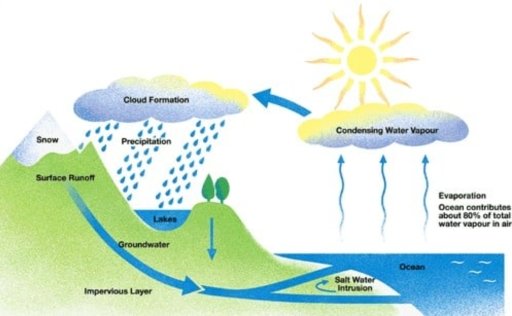
The diagram shows the water cycle, which is the continuous movement of water on, above, and below the surface of the Earth.
Summarize the information by selecting and reporting the main features, and make a comparison where relevant.
You should write at least 150 words
The diagrams below show the stages and equipment used in the cement-making process, and how cement is to produce concrete for building purposes.
Summarize the information by selecting and reporting the main features, and make a comparison where relevant.
You should write at least 150 words
Below is a map of the city of Brandfield. City planners have decided to build a new shopping mall for the area, and two sites, S1 and S2 have been proposed.
Summarize the information by selecting and reporting the main features, and make a comparison where relevant.
You should write at least 150 words